Cost-Benefit Calculator for High-Cost Medications
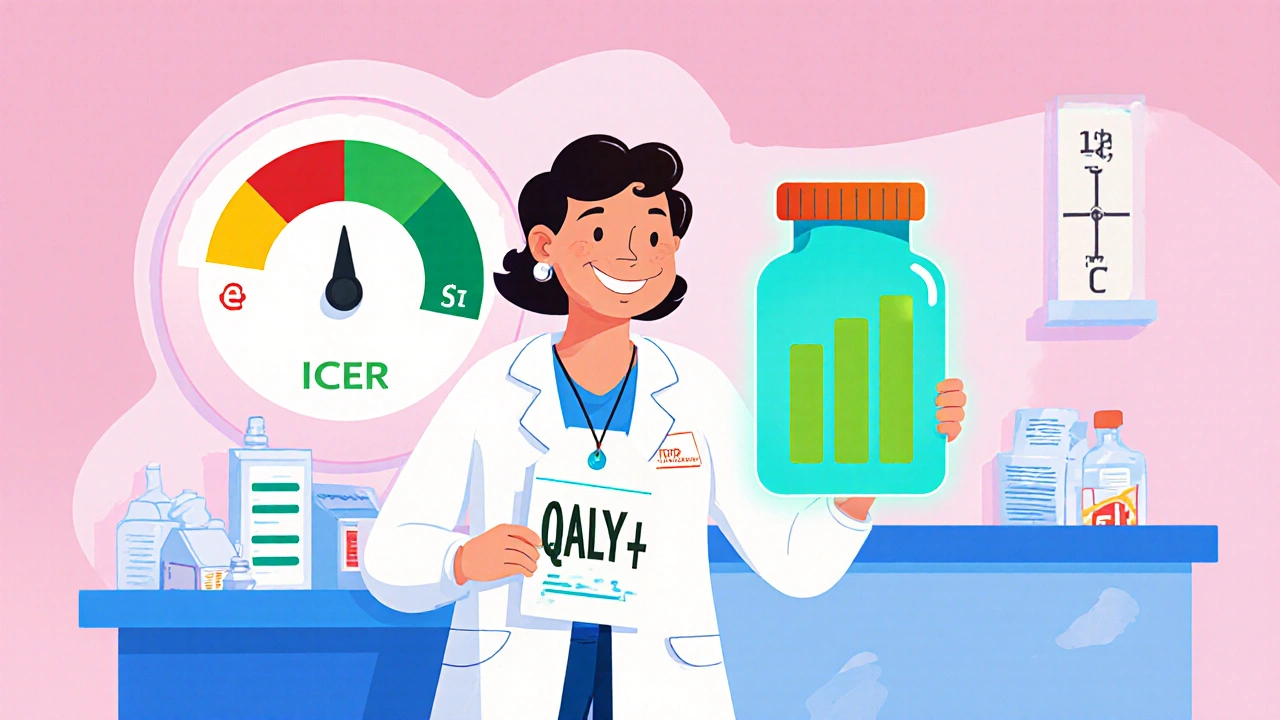
This calculator helps determine if a high-cost medication is cost-effective by comparing its Incremental Cost-Effectiveness Ratio (ICER) to standard thresholds. Based on article concepts: QALY (Quality-Adjusted Life Year), ICER, and side-effect considerations.
Input Drug Costs
Health Impact Metrics
Quick Takeaways
- High‑cost medications can be justified when the health gain outweighs the price and side‑effect burden.
- Key metrics - QALY and ICER - translate clinical outcomes into dollar terms.
- Insurance design (Medicare Part D, specialty pharmacy support) often decides whether a patient can actually access the drug.
- Patient‑assistance programs and manufacturer copay‑help can shrink out‑of‑pocket costs by 30‑40%.
- A step‑by‑step decision framework lets clinicians and patients weigh benefit, risk, and affordability together.
What Exactly Is a high‑cost medication?
In everyday language a high‑cost medication is any prescription drug whose list price exceeds $10,000 per treatment course or $1,000 per month. Most of these are biologics, gene‑therapy products, or orphan drugs targeting rare diseases. The 2023 NIH cross‑sectional study showed the median price of the 50 most expensive U.S. drugs was $16,178 per dose, with biologics making up 62% of the group.
Why Do We Need a cost‑benefit analysis?
Because a drug’s price alone doesn’t tell the whole story. A rigorous cost‑benefit analysis (CBA) asks: “What health benefit does the drug deliver, and is that benefit worth the out‑of‑pocket and societal cost?” This framework originated in the 1970s with health‑technology assessment (HTA) agencies like the UK’s NICE. Today, payers, clinicians, and patients all use CBA to decide whether a pricey therapy should stay on the formulary or be prescribed.
Core Economic Metrics That Turn Health Into Money
Three numbers dominate the conversation:
- Quality‑adjusted life year (QALY) - a combined measure of length and quality of life. One QALY equals one year in perfect health.
- Incremental cost‑effectiveness ratio (ICER) - the extra cost required to gain one additional QALY compared with the next best alternative.
- Threshold values - in the U.S. many payers use $50,000‑$150,000 per QALY as a rough benchmark; the UK’s NICE fixes it at £20,000‑£30,000 per QALY.
If an ICER falls below the chosen threshold, the drug is considered cost‑effective. If it sits above, decision‑makers must look at other factors such as severity of disease, lack of alternatives, or societal willingness to pay.
Side Effects: The Hidden Cost
High‑cost drugs often carry serious adverse‑event profiles-think cytokine‑release syndrome with CAR‑T therapy or liver toxicity with some kinase inhibitors. When running a CBA, side effects are translated into QALY losses. For instance, a drug that adds 0.8 QALYs but causes a 0.1 QALY drop from frequent hospitalizations may end up with a net gain of only 0.7 QALYs, raising the ICER.
Clinicians therefore need robust safety data, real‑world evidence, and patient‑reported outcomes to quantify the quality‑of‑life penalty accurately.
Real‑World Examples Where Expensive Drugs Made Sense
Below are three cases where the health gain outweighed the price and side‑effect risk.
| Drug (Indication) | Annual Cost (USD) | QALY Gain | ICER (USD/QALY) | Main Side Effects |
|---|---|---|---|---|
| Harvoni (Hepatitis C) | $7,153 | 0.95 | $7,530 | Fatigue, mild headache |
| Daratumumab (Multiple Myeloma) | $125,000 | 0.60 | $208,300 | Infusion reactions, neutropenia |
| Tisagenlecleucel (CAR‑T for ALL) | $475,000 | 1.30 | $365,400 | Cytokine release syndrome, neurotoxicity |
Notice how Harvoni’s ICER is far below typical thresholds, making it a clear win despite a $7k price tag. The CAR‑T therapy’s ICER looks high, but for patients with no other curative options the quality‑of‑life boost and potential cure justify the expense.
Insurance Mechanics: How Medicare Part D Influences Access
Medicare Part D splits drug spending into four phases: deductible, initial coverage, the “donut hole,” and catastrophic coverage. A 2022 KFF study found most beneficiaries misunderstand these phases, leading to surprise out‑of‑pocket bills. For ultra‑expensive drugs, the catastrophic phase often kicks in early, meaning patients still pay roughly 5% of the price after hitting the threshold.
Example: A patient on Revlimid faced $11,538 in total out‑of‑pocket costs in 2016, 76% of which was incurred during the catastrophic phase. Without supplemental coverage, even a drug deemed cost‑effective can become unaffordable.
Financial Safety Nets: patient‑assistance programs and Foundations
Manufacturers now run copay‑assist programs that cover up to 40% of out‑of‑pocket costs for commercially insured patients (2023 data). Independent foundations-like the Chronic Disease Fund-dispensed $2.1 billion in aid in 2022, often targeting orphan‑drug patients.
When evaluating an expensive medication, ask your provider about three things:
- Is there a manufacturer copay‑assist or patient‑access program?
- Does the disease‑specific foundation have grant eligibility?
- Can a specialty pharmacy case manager help navigate prior‑authorization and step‑therapy requirements?
Decision Framework: A Step‑by‑Step Checklist for Patients and Clinicians
Use this practical checklist to decide whether a high‑cost drug is worth the spend.
- Confirm clinical efficacy: review Phase III trial data and real‑world outcomes.
- Calculate the ICER using the drug’s price, alternative costs, and QALY gain.
- Compare the ICER against the relevant threshold (e.g., $150,000/QALY for U.S. payers).
- Quantify side‑effect burden: translate expected adverse events into QALY loss.
- Map insurance coverage: check Medicare Part D phases, prior‑authorization steps, and specialty pharmacy involvement.
- Identify financial assistance: manufacturer programs, foundations, state Medicaid waivers.
- Make a joint decision: patient preferences, risk tolerance, and financial capacity should all be part of the conversation.
Following these steps reduces the risk of surprise bills and ensures the chosen therapy truly adds value.
Future Trends Shaping Cost‑Benefit Decisions
Two forces will reshape the landscape in the next five years:
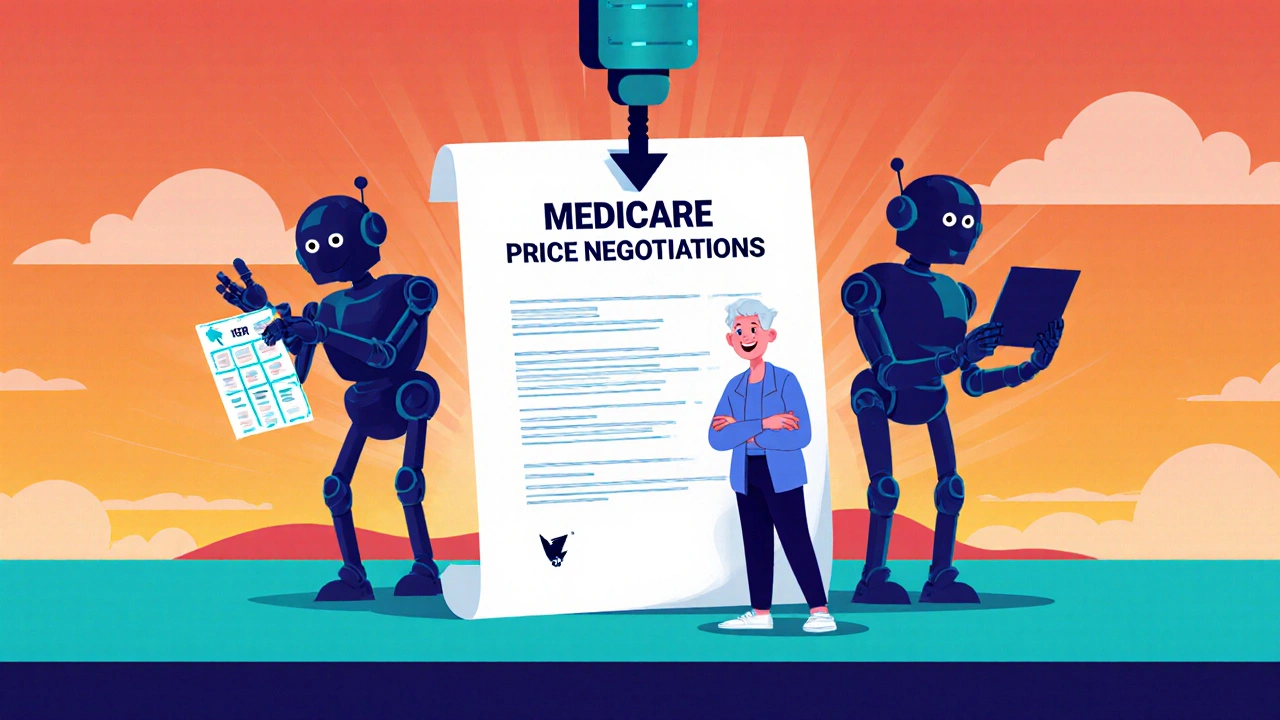
- Medicare price negotiations under the Inflation Reduction Act will force many high‑cost drugs to lower their net price, potentially pulling more therapies under accepted ICER thresholds.
- The rise of independent cost‑effectiveness reviews (by ICER, IQWiG, HAS) will give clinicians clearer, evidence‑based guidance on which drugs meet value standards.
Patients who stay informed about these shifts can time their treatment starts to benefit from lower prices or new value‑based contracts.
Key Takeaway Checklist
- Gather solid efficacy data before considering price.
- Use QALY and ICER to translate health gain into monetary terms.
- Factor side‑effect‑related QALY losses into the calculation.
- Map out insurance coverage phases and look for assistance programs early.
- Apply the 7‑step decision framework with the patient at the center.
What is a reasonable ICER threshold in the United States?
Most U.S. payers treat $100,000‑$150,000 per QALY as a soft ceiling. Anything below $50,000 is usually considered a strong value proposition.
How do I find out if a drug has a manufacturer copay‑assist program?
Visit the drug’s official website, look for a “Patient Assistance” link, or ask your specialty pharmacist. Many programs require proof of income or insurance status.
Can side effects ever make a cost‑effective drug unacceptable?
Yes. If adverse events significantly lower quality of life, the QALY gain can be offset, pushing the ICER above the acceptable threshold.
What role does the Orphan Drug Act play in pricing?
The Act grants seven‑year market exclusivity and tax credits, encouraging companies to develop therapies for rare diseases-often leading to very high list prices.
Is there a way to lower out‑of‑pocket costs for biologics?
Besides copay‑assist programs, patients can explore state Medicaid waivers, pharmacy discount cards, or enrollment in clinical trials that cover the investigational drug.
Comments (9)
-
Charlene Gabriel October 26, 2025
When you sit down to weigh a $200,000 gene‑therapy against a handful of quality‑adjusted life years, the math can feel overwhelming.
The first step, however, is simply to lay out the clinical endpoint data in plain language for every stakeholder.
Imagine a patient who has exhausted all standard options and now faces a therapy that can add nearly a full QALY, even if the price tag looks scary at first glance.
By translating that gain into a dollar figure through the ICER, we can see whether the therapy sits below the $150,000 per QALY ceiling that many U.S. payers use.
If the resulting ICER is, say, $120,000 per QALY, the drug is technically cost‑effective, and the conversation can shift toward real‑world logistics.
This is where insurance design enters the picture, because Medicare Part D’s catastrophic phase can dramatically reduce the patient’s out‑of‑pocket burden.
In parallel, many manufacturers now run copay‑assist programs that cover up to 40 % of what the patient would otherwise pay.
Foundations and disease‑specific charities often have grant eligibility criteria that can further shave off the residual cost.
All these levers together mean that the headline $250,000 price tag does not have to become a financial death sentence.
It is also crucial to factor in the side‑effect profile because adverse events translate into QALY losses that push the ICER upward.
For instance, a drug that adds 0.8 QALYs but incurs a 0.1 QALY penalty from hospitalizations will still net a 0.7 gain, reshaping the cost‑effectiveness equation.
Communicating these nuances to patients with empathy can demystify the process and empower shared decision‑making.
When patients see a step‑by‑step checklist that includes efficacy, ICER calculation, side‑effect burden, insurance mapping, and assistance programs, anxiety often eases.
Moreover, staying informed about upcoming Medicare price negotiations can help clinicians time therapy initiation for maximum financial benefit.
In my experience, a collaborative approach that treats the patient as a partner, not a passive recipient, leads to better adherence and outcomes.
So, while high‑cost drugs can appear prohibitive, a systematic, patient‑centered framework turns the daunting numbers into actionable, affordable choices.

-
Carolyn Cameron November 4, 2025
In the realm of cost‑effectiveness analysis, the preponderance of evidence compellingly suggests that the threshold of $100,000 to $150,000 per QALY retains its heuristic utility across heterogeneous payer environments. Notwithstanding, the methodological rigor inherent in ICER computation necessitates scrupulous inclusion of both direct pharmacoeconomic inputs and indirect morbidity costs. Accordingly, the exemplary case of Harvoni, with an ICER of $7,530 per QALY, unequivocally demonstrates the archetype of value‑based pricing. Conversely, therapies whose incremental ratios exceed the upper bound demand a nuanced deliberation of societal willingness to pay, particularly in the context of orphan indications.

-
Samantha Taylor November 14, 2025
Obviously, anyone who believes that a $475,000 price tag automatically disqualifies a therapy from being worthwhile is engaging in a most superficial analysis. The formal cost‑benefit equation, when properly populated with QALY gains and side‑effect penalties, often reveals a subtler truth. Moreover, the sarcastic notion that insurers simply hand out cash for high‑priced drugs ignores the intricate prior‑authorization gauntlet. One must also acknowledge, with a hint of dry humor, that the very existence of manufacturer copay‑assist programs is a testament to market manipulation rather than altruism.

-
Joe Langner November 23, 2025
Theres a lot of hope when you see that a drug like Daratumumab can actually add .6 QALYs, even if the price looks scary at first.
Its important to remember that the ICER might be high but still fall within the soft ceiling that many payers accept.
I like the idea that patient assist programs can cut down out‑of‑pocket costs, and thats a big win for folks who are on a tight budget.
Overall, staying optimist and looking at the full picture is key.

-
Leah Ackerson December 2, 2025
While the numbers can be dazzling, we mustn't lose sight of the human experience behind them 😊.
The ethical dimension of allocating scarce resources is as complex as it is essential, and a little empathy goes a long way 🙏.
Remember, statistical models are tools, not substitutes for compassionate care.

-
Gary Campbell December 11, 2025
One cannot ignore the shadowy influence of the pharmaceutical lobby in shaping both list prices and the thresholds that payers accept. The fact that many ICER studies are funded by the very companies whose drugs are being evaluated raises questions about impartiality. Moreover, the recent push for Medicare price negotiations feels less like a policy win and more like a controlled concession designed to maintain the status quo. When you strip away the veneer, the pattern of profit‑maximization becomes unmistakably clear.

-
renee granados December 21, 2025
The pharma lobby controls everything.

-
Stephen Lenzovich December 30, 2025
The United States has always led the world in medical innovation, and it's no surprise that we also lead in the willingness to pay for breakthrough therapies. That same pioneering spirit should translate into robust support for patients navigating these costly treatments, not into hollow patriotism that ignores real financial hardship. By embracing transparent pricing and value‑based contracts, we can preserve our competitive edge while ensuring that American families aren't left to shoulder unbearable bills. It’s time to align our national pride with practical compassion.

-
abidemi adekitan January 8, 2026
Let’s think of this whole cost‑benefit puzzle as a vibrant tapestry, each thread representing efficacy, safety, price, and patient hope.
By weaving those strands together with creativity and genuine care, we can illuminate pathways that were previously hidden in the shadows.
So, if you’re feeling daunted by the numbers, remember that collaboration and imagination can turn even the most complex analysis into a work of art that guides real‑world decisions.
